iMagic Inventory
Solutions
Editions
Our Customers
Articles and Guides
Support
Who We Are

Intuition is often overlooked in business as some kind of voodoo, but what if you could trust it by measuring your ideas before acting on them?
I'm a big believer in listening to my gut feelings. Yes sure look yes I watched too much Murder She Wrote on TV when I was a kid. For those not in the know, it was a family show about a well-to-do lady that would solve a murder case each week. How she was never investigated for always being around people getting murdered was never dealt with but I suspect it was all her and we were in fact watching a forerunner to Dexter.
The big idea in the show though is how the main character at some critical point in the story has a gut feeling about some event that leads to solving the case. Of course! Everyone (usually the police detective) cheers at the end. Depending on the character it would either be followed by a big congratulations, thank you and fierce shaking of hands or a scowl of jealously that they couldn't have worked it out from the seemingly, and let's face it completely unrelated, clues to the crime.
I'm sure gut feelings lead to solving of crime in real life, the big difference of course is that you have to prove your gut feelings. That's no different in business. You don't want to commit your entire advertising budget on a gut feeling without some evidence of a return to base it on.
One of the great benefits of using iMagic Inventory for a while is the ability to test ideas. If you get a gut feeling about something you can take a look, see if it's right, and start to understand what your gut feeling is trying to tell you.
It's not immediately obvious when you first start creating invoices but what you're also doing is creating a trail of evidence and clues. The longer the period of time that goes on the more accurate those clues will get and the more obvious they'll be.
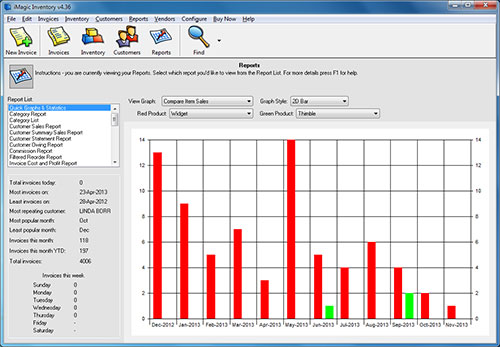
One way is with the Compare Item Sales feature tucked away under the Statistics section. Suppose you have an idea that a product isn't performing and you're considering dropping it in favor of a newer product. Well that's easy to test, use the Compare Item Sales, select the item in question and another product that you know is either selling well or not selling at all. Depending on which graph matches you'll have hard facts that you can make a decision on. All from a gut feeling.
Here's what to do:
- Jump over to Reports.
- Click on the Quick Graphs & Statistics.
- Change the View Graph to Compare Item Sales.
- Change the Graph Style to 2D Bar (3D looks pretty, but 2D is best for analysis).
- Now change the Red Product to the first product and Green Product to the one you want to compare.
So now you can solve crimes like a well-to-do lady and help the local detective. But shhh we know what you're really up to - it'll be out little secret, just don't get caught...